Python example to read a system matrix from a HDF5 file#
This example demonstrates how to read a system matrix from a HDF5 file. The system matrix is generated by the pymatcal package. The system matrix is a 5D array with the following dimensions: (number of tangential shifts, number of radial shifts, number of rotation angles, number of detectors, number of bins). The system matrix is stored in a HDF5 file with the dataset name systmat.
import numpy as np
import h5py
import matplotlib.pyplot as plt
f = h5py.File('test_small.hdf5', 'r')
sysmat = np.asarray(f['systmat'])
print(sysmat.shape)
fig, axs = plt.subplots(1,2,figsize=(16,9))
id_det, id_rot, id_r, id_t = (0, 0, 0, 0)
data=sysmat[id_t,id_r,id_rot,id_det]
# data1=sysmat[id_t,id_r,5,id_det]
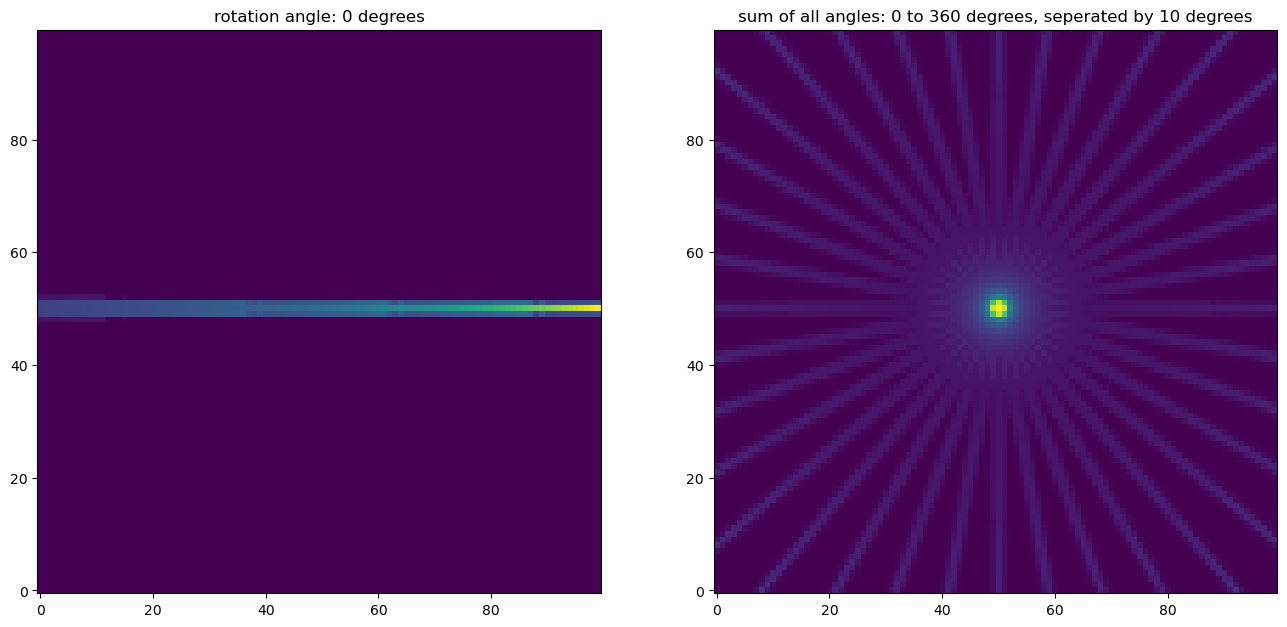
datasum = np.sum(sysmat[id_t,id_r,:,id_det],axis=0)
titles=[
'rotation angle: 0 degrees',
'sum of all angles: 0 to 360 degrees, seperated by 10 degrees',
]
for id in range(0,2):
axs[id].set_title(titles[id])
axs[0].imshow(data.reshape(100,100), origin='lower')
# axs[1].imshow(data1.reshape(100,100), origin='lower')
axs[1].imshow(datasum.reshape(100,100), origin='lower')
plt.show()
(1, 1, 36, 1, 10000)
f.close()
f = h5py.File('test_small_rshift.hdf5', 'r')
sysmat = np.asarray(f['systmat'])
print(sysmat.shape)
fig, axs = plt.subplots(1,2,figsize=(16,9))
id_det, id_rot, id_r, id_t = (0, 0, 0, 0)
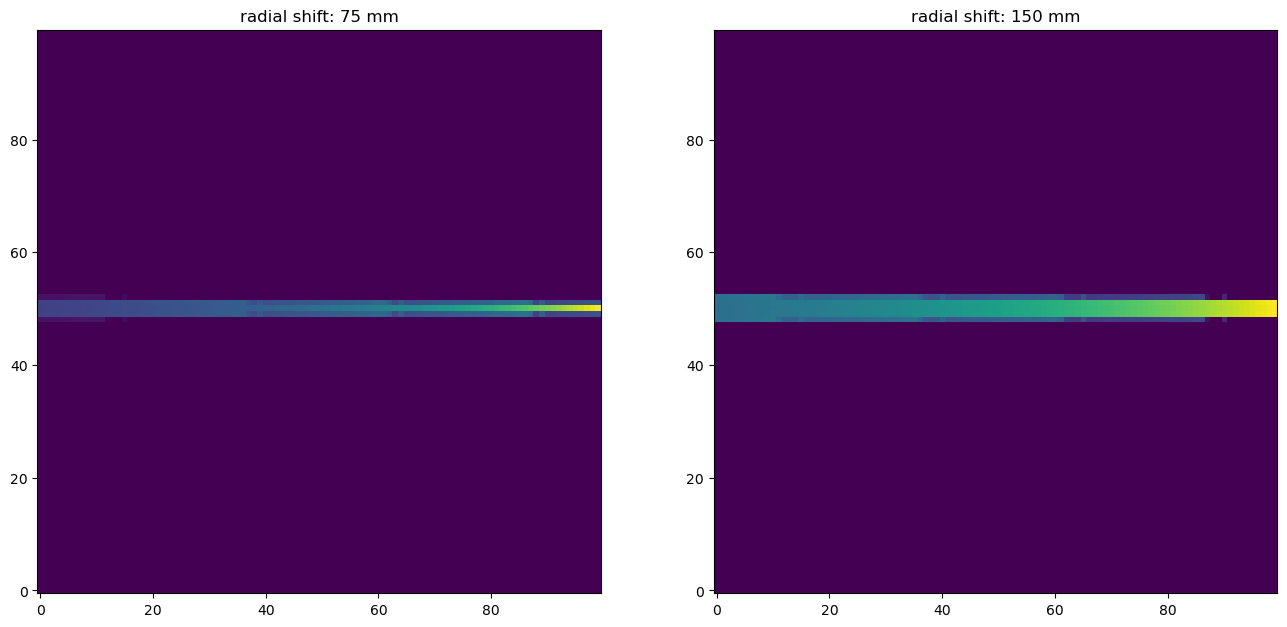
data=sysmat[id_t,id_r,id_rot,id_det]
data1=sysmat[id_t,1,id_rot,id_det]
# datasum = np.sum(sysmat[id_t,:,0,id_det],axis=0)
axs[0].imshow(data.reshape(100,100), origin='lower')
axs[1].imshow(data1.reshape(100,100), origin='lower')
titles=[
'radial shift: 75 mm',
'radial shift: 150 mm',
]
for id in range(0,2):
axs[id].set_title(titles[id])
# axs[1].imshow(datasum.reshape(100,100), origin='lower')
plt.show()
(1, 2, 2, 1, 10000)
f.close()
f = h5py.File('test_small_tshift.hdf5', 'r')
sysmat = np.asarray(f['systmat'])
print(sysmat.shape)
fig, axs = plt.subplots(1,2,figsize=(16,9))
id_det, id_rot, id_r, id_t = (0, 0, 0, 0)
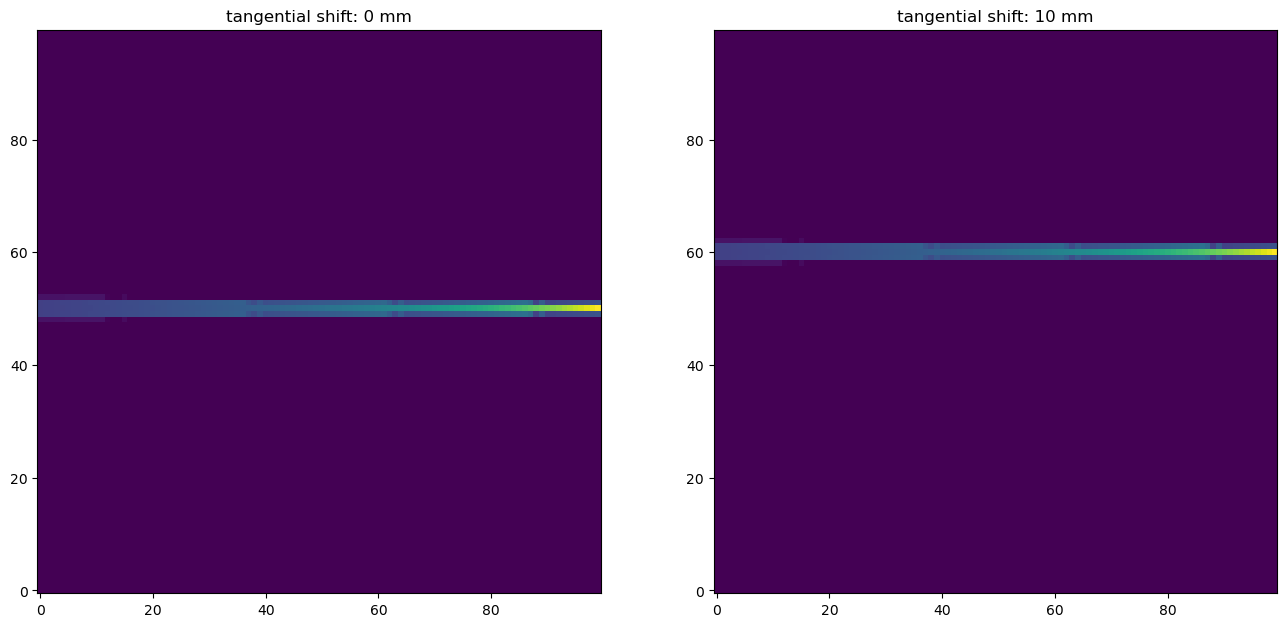
data=sysmat[id_t,id_r,id_rot,id_det]
data1=sysmat[1,id_r,id_rot,id_det]
# datasum = np.sum(sysmat[id_t,:,0,id_det],axis=0)
axs[0].imshow(data.reshape(100,100), origin='lower')
axs[1].imshow(data1.reshape(100,100), origin='lower')
titles=[
'tangential shift: 0 mm',
'tangential shift: 10 mm',
]
for id in range(0,2):
axs[id].set_title(titles[id])
# axs[1].imshow(datasum.reshape(100,100), origin='lower')
plt.show()
(2, 1, 2, 1, 10000)
Developing the documetation